Stock Prediction Datathon at Schonfeld
Last week, I was in a “datathon” organized by Schonfeld, a global hedge fund based in New York City. It was a very interesting challenge, organized in a nice way that induces technical excellence, creativity, and teamwork.

The problem statement
The competition goal was to predict as closely as possible the 5-day cumulative return of at least 1000 stocks per day during 2021-2023, where each daily prediction can be used based on available data of all earlier days which can date back to 2009.
Participants are given the following data:
- The unique identifiers (called
cwiq_code) of over 2000 IPO companies in North America from 2009 to 2020. This time range can be seen as the training and validation data. - For each stock and on each date, the trading data such as closing prices, volume, dividents, etc. are given. The closing prices are used to calculate the target variable, which is SF5_F1 – 5-day cumulative log-return.
-
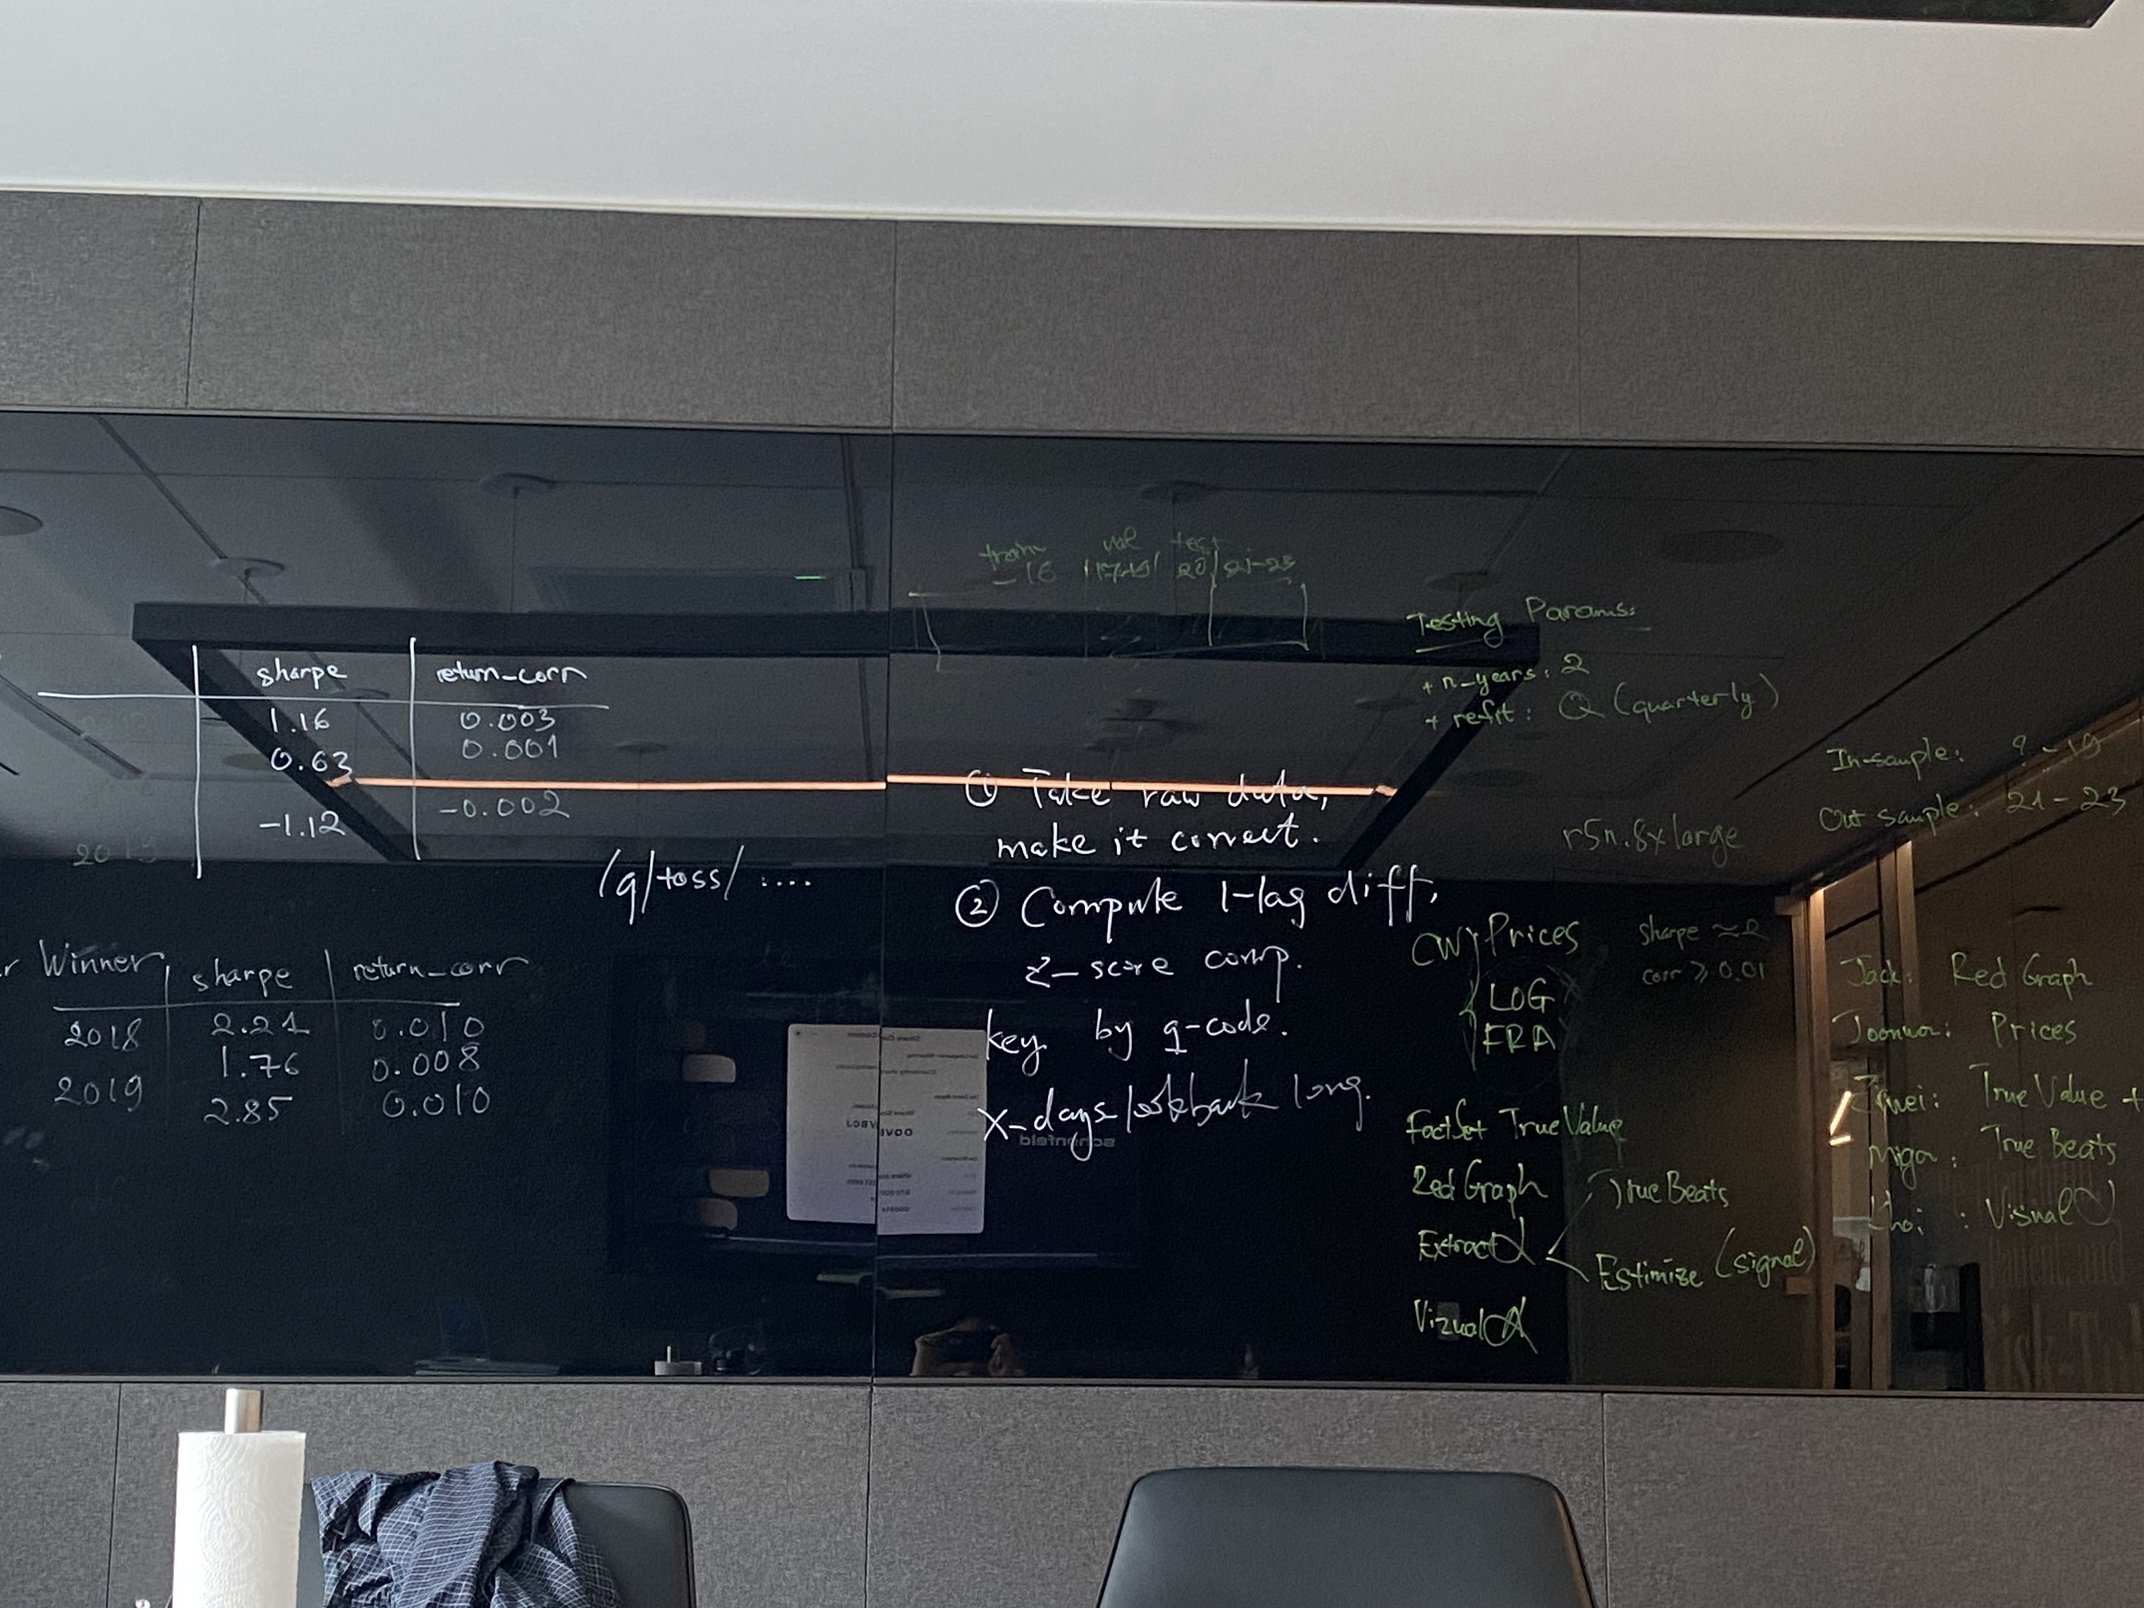
More excitingly, for each stock per day, hundreds of other variables are given to us from proprietary data vendors, including FactSet’s TrueValue, RedGraphs, Extract Alpha’s Estimize and TrueBeats, and Visible Alpha.
- What are those variables about? That is the core task of the competition. We are given the numerical values of all variables along with their documentation. Our job was to figure out what they meant and how to leverage them for stock prediction.
- Broadly, FactSet and RedGraphs are called alternative data – data about other non-stock aspects of the actual companies. Meanwhile, Estimize, TrueBeats, and Visible Alpha are all estimate data, which are data trying relate to the actual prices of the stocks.
Evaluation
- During final evaluation, the whole training and evaluation pipeline will be run to predict the returns during 2021-2023.
- For each year during that period, the returns predicted by a model are evaluated over 5 metrics: sharpe, return correlation, max dropdown, up-down ratio, and dollars traded.
- All teams are ranked against each other for each metric in each year. The final rank is the average across all metrics and years. The team with the highest final rank wins.
Competition format
Every data analysis and implementation is done via a web-based JupyterLab interface (which is acceptably annoying because JuLab is far worse than my native VSCode setup). Thirty participants are grouped into 5-people team and were given the data and platforms one week before the actual contest day. In the contest, we have 4.5 hours to engineer as good as possible features to predict the target variable.
The participants
30 PhD students, mostly 3rd-year, from all over America. They have people from the best schools like MIT, CMU, Harvard, Princeton, Cornell, and UT Austin. Other schools that I can remember are Duke, Rutgers, Northwestern, SUNY, CUNY, U Delaware, some more, and the legendary school of UT Dallas.
The winning team is the one that has a student from MIT. He said it took him only 1 hour to implement the solution.
Learnings
- Financial vocabularies: return (selling price - buying price), F1 (log-return after one day), SF5 (sum of log-returns over 5 days), SF5_F1 (SF5, but minus F1 because one day is needed to see the closing price of today), ESG, dividents, stock split, trading days (252 in a year), etc.
-
Statistical literacy
- Stock prediction is hard because the test is completely unseen, which they call out-of-distribution (OOD) data. All hypotheses are tested on in-distribution (ID) data only, because that OOD data is obviously not available during preparation time. And even when you remember everything over the last 20 years, who knows what will happen tomorrow?
- How to bridge the gap between OOD and ID? Statistically, we need to process the variables to make them stationary. A variable is non-stationary iff its moments (mean, stdev, etc.) stay the same over time. Prices, for example, are not a stationary variable because their mean changes over time.
- How to make variables stationary? We can use normalization techniques, such as demean/demidian/z-score over some populations such as all stocks on the same day, or all companies in the same category (e.g., industry). Another trick is to do something like rolling mean/median. Taking log-return instead of raw return is also for normalization.
- To evaluate the usefulness of a single feature, we should calculate its auto-correlation first, which is usually the Pearson correlation coefficient between a series and its lagged series. The result is in [0; 1], which can be interpreted in some way I don’t remember exactly.
-
Computer Science
- LightGBM, standing for Light Gradient Boosting Machine, is a highly effective model that is robust to correlated features in the data. With this model, all we need to do in prediction tasks is too create as many helpful features as possible, allowing correlations between them. LightGBM will “automatically” deal with them and decide which one are actually important for prediction.
- The mentor of our team codes very sharply under high stress, which inspires me to train for higher level of productivity in programming.
- In stock prediction, people use NLP a lot to process raw text scrapped from the internet about the companies. They need automatic ways to listen to the companies. Also, graph-theory languages such as centrality, eigenvalue, and betweenness are used frequently when a dataset models the stocks as nodes in a cash-flowing graph.
- Prospects of a quant career: Being a quant seems to be fun because there are a lot of challenges in statistics and programming. The stake here is high, stress is much, but returns are also abundant.