
Picture of The Day on Discrete Distributions
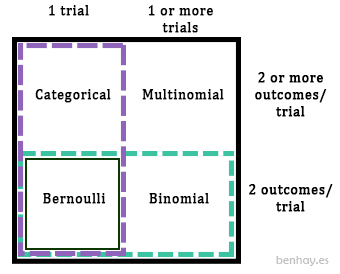
I’m learning these distributions in the context of Naive Bayes. It’s reminding me of a tough time learning Bayesian Statistics. But this chart is doing a good job at distinguishing between the distributions.
Comments